First, we need to understand a basic concept: to handle incoming validator deposits from the execution layer, you need to run both an execution client and a consensus client. This means we need to deploy at least two client programs (three in this tutorial, as the consensus client is split by functionality).
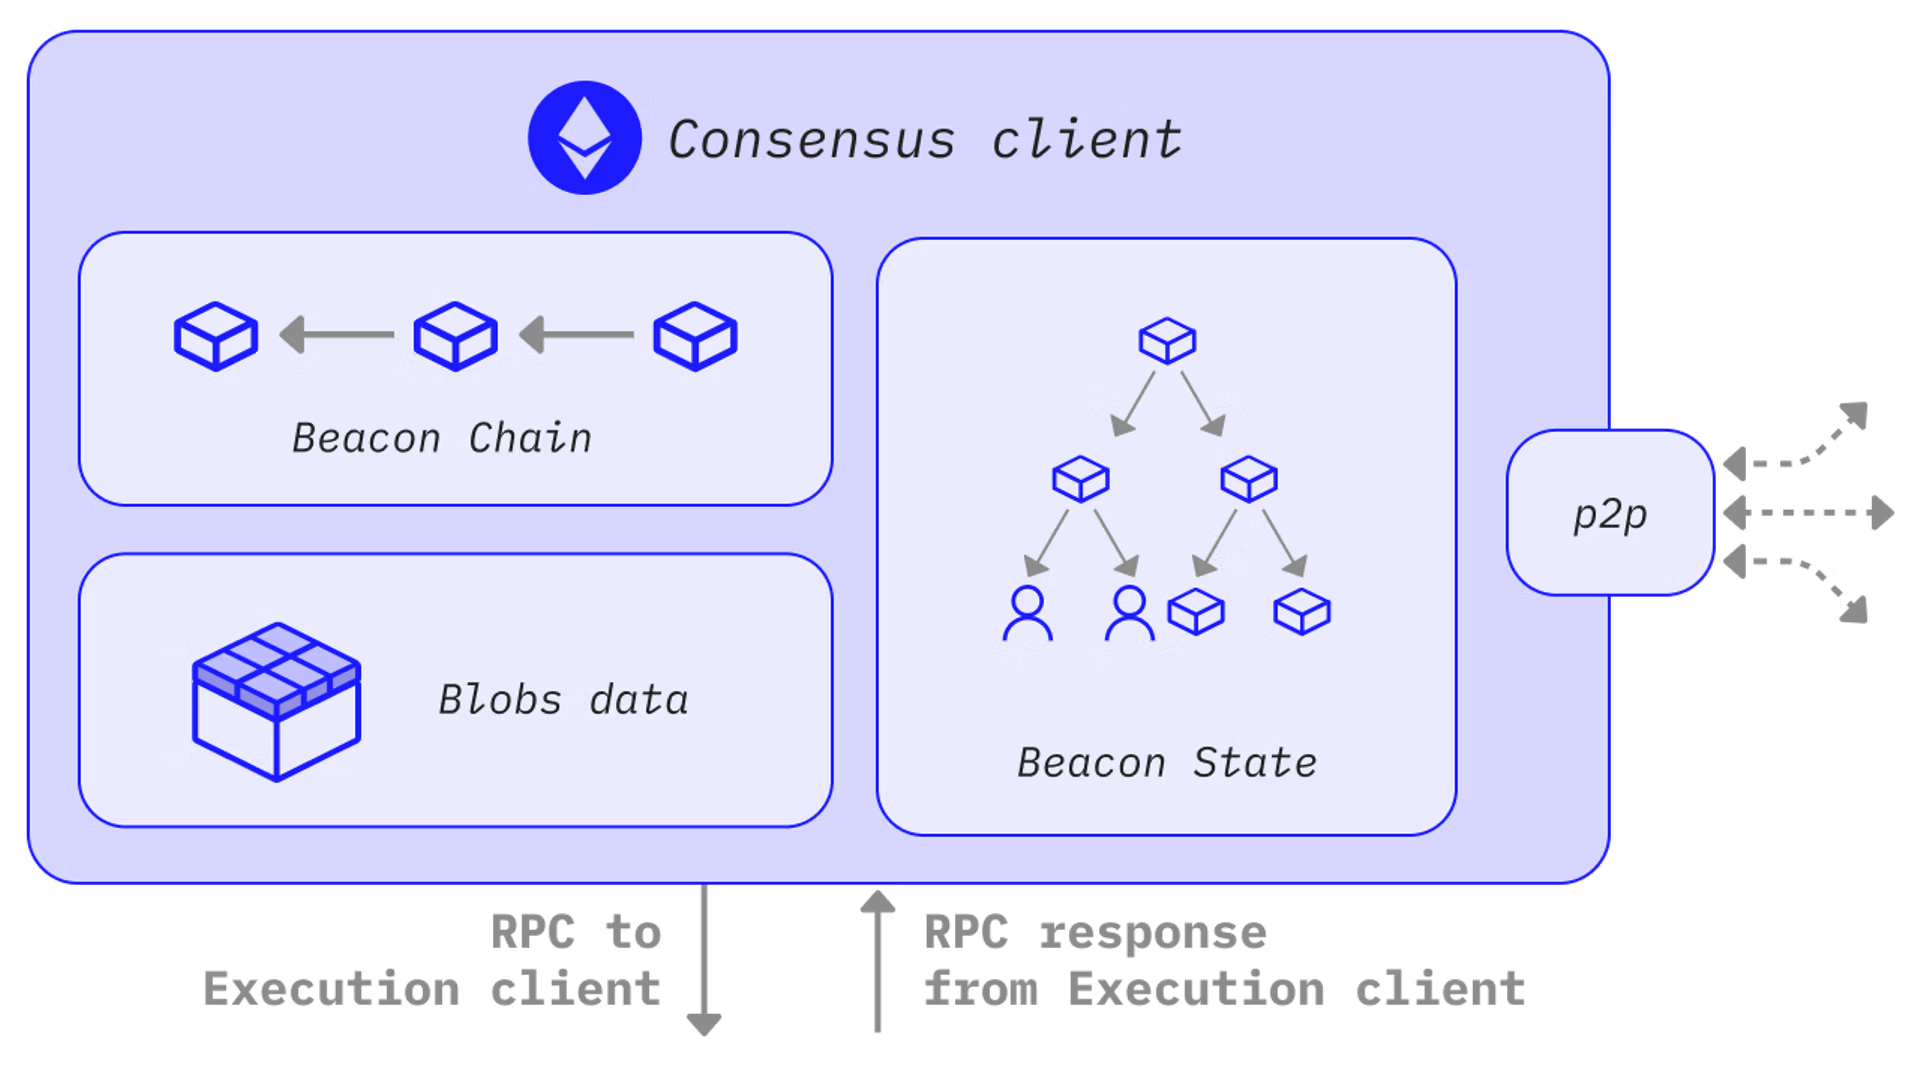
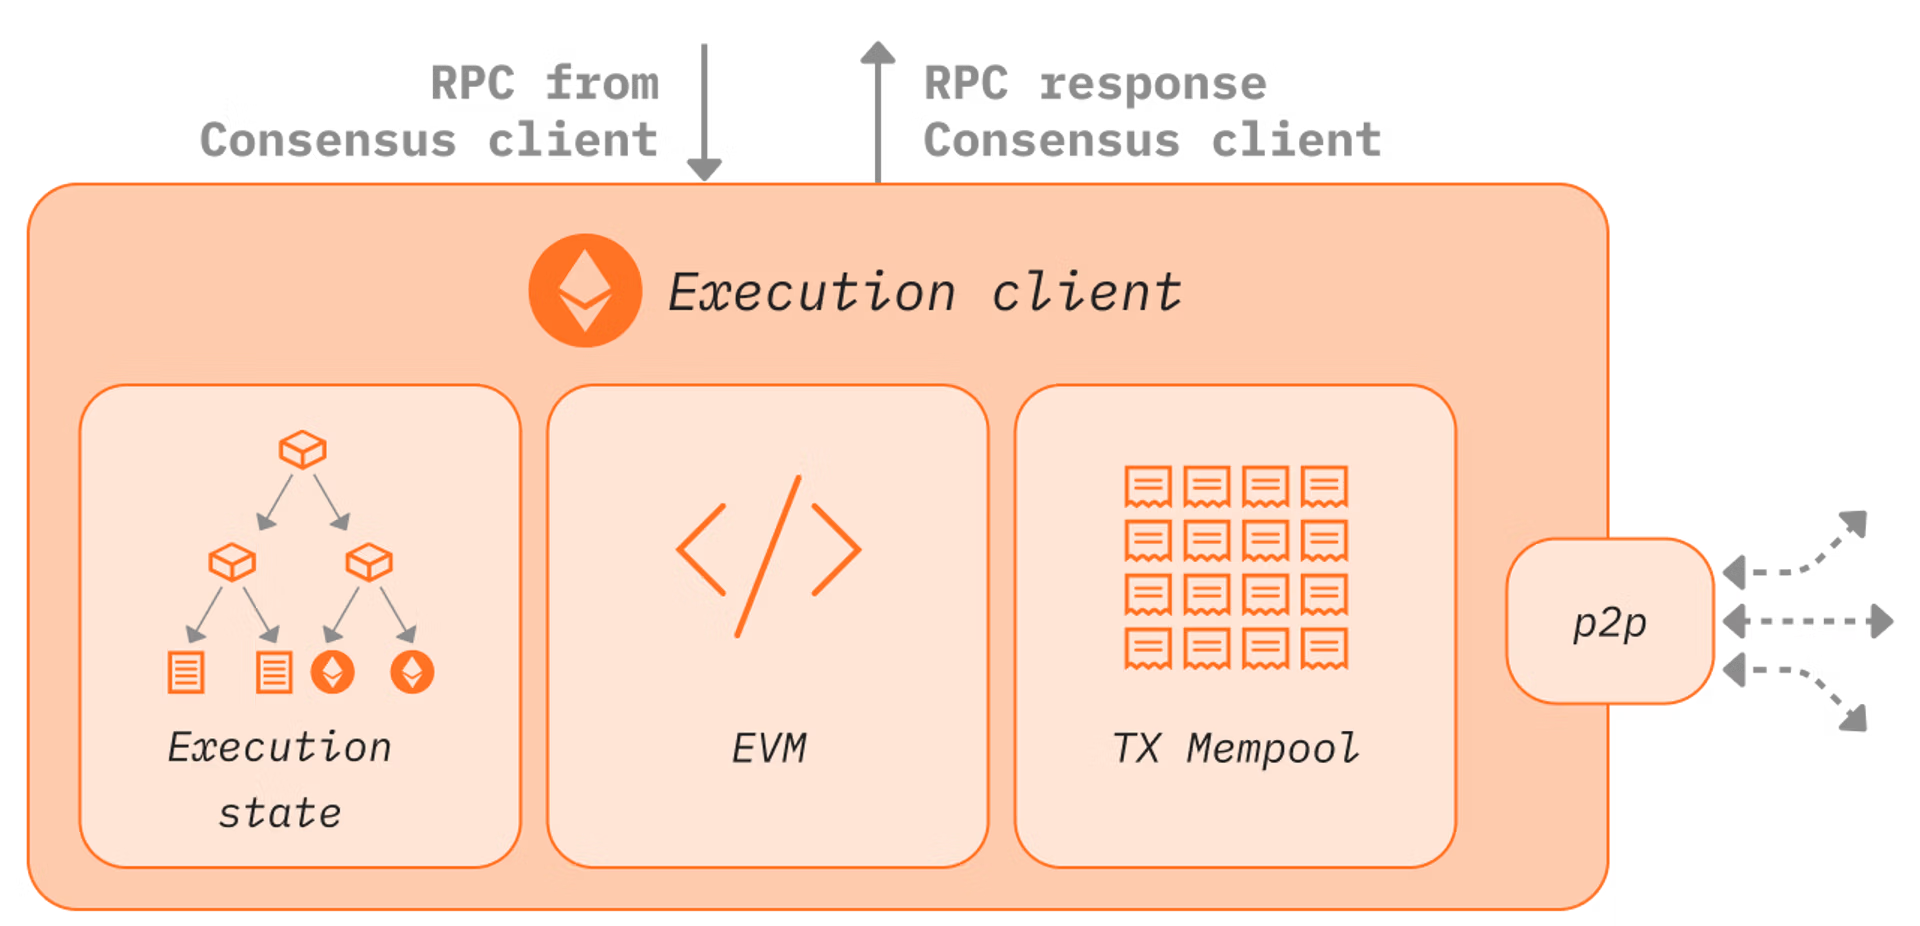
If you want to learn more about the differences and functional responsibilities of the execution client and consensus client, you can click to read: https://ethereum.org/zh/developers/docs/networking-layer/
1. Choose Execution Client
There are many types of clients in the Ethereum ecosystem, with both execution clients and consensus clients having implementations in various languages, such as Geth implemented in Go and Reth implemented in Rust. You can choose different clients based on your preference; the overall process is similar, but the commands involved vary between clients. Here, we cannot provide deployment tutorials for all clients, so the tutorial uses Reth as the execution client (purely a personal preference, not guaranteed to be the most performant).
Additionally, the tutorial uses the method of compiling from source for deployment. In fact, almost every client provides a Docker-based deployment method, which you can choose at your discretion. However, I personally recommend using the source compilation method, as it helps in troubleshooting issues when the documentation does not provide effective assistance by allowing you to inspect the source code to find and resolve the problem.
1.1 Setup Basic Development Environment
- build-essential
sudo apt install build-essential- gcc, g++, make, cmake, clang
sudo apt install gcc g++ make cmake clang- Rust
curl --proto '=https' --tlsv1.2 -sSf <https://sh.rustup.rs> | sh1.2 Build and Execute the Program from Source Code
- Download the Reth source code
git clone <https://github.com/paradigmxyz/reth>
cd reth- Switch to version v1.1.1
git checkout v1.1.1- Compile and install the Reth executable
cargo install --locked --path bin/reth --bin rethAfter compilation, you can access the binary file using the reth command from the command line, and the binary file will be located in the default .cargo/bin folder.
1.3 Start Reth
- Run Reth as a full node
reth node --fullThe execution output is as follows:
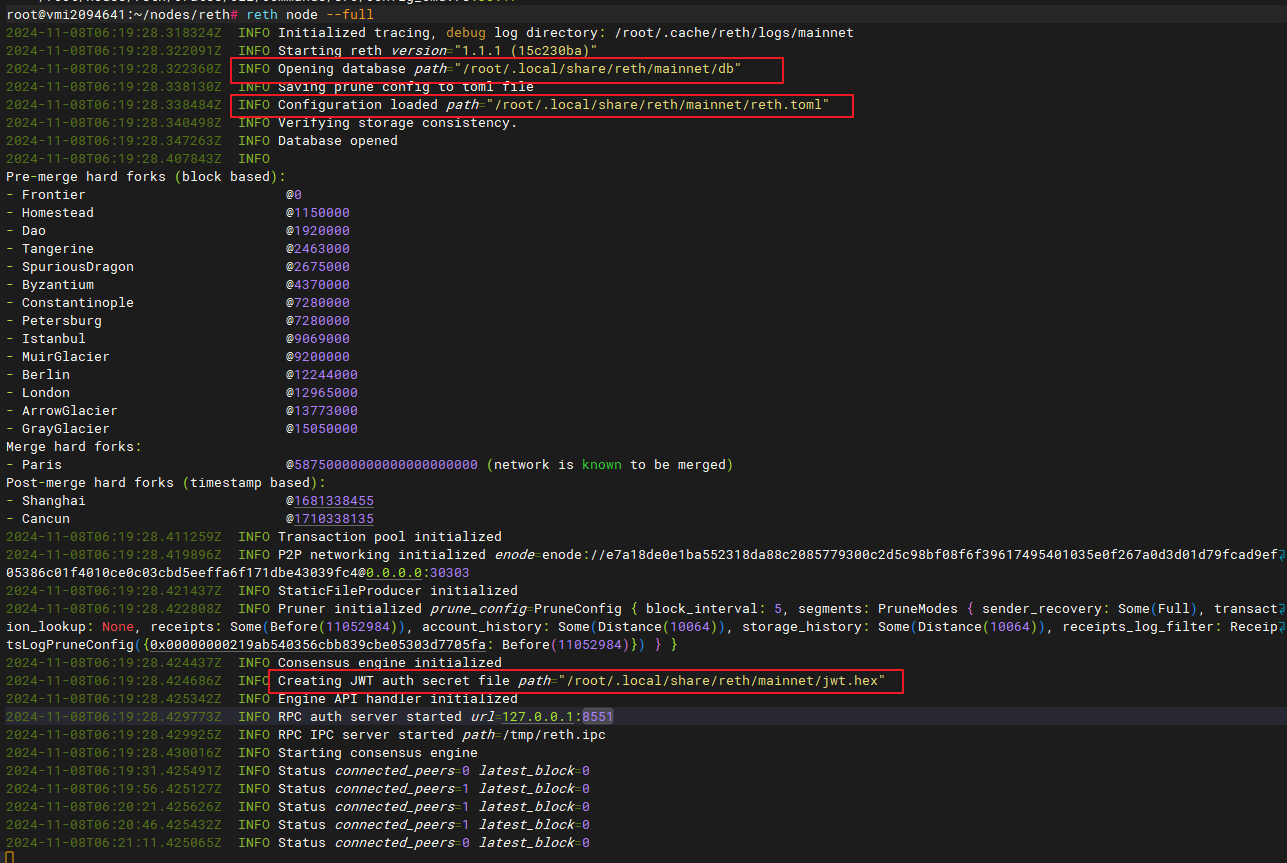
The three paths circled in red in the diagram represent:
- Block data storage directory
- Reth node runtime configuration
- JWT authentication file
The JWT authentication file should also be specified as this path when running the consensus client.
Additionally, when you stop the program, you will see the following output:
2024-11-08T06:21:58.643464Z INFO Wrote network peers to file peers_file="/root/.local/share/reth/mainnet/known-peers.json"This file records some known nodes that have been discovered, with an example content as follows:

- Start a node on the Holesky testnet
Currently, the networks directly supported by Reth at the command line level are:
mainnet,sepolia,holesky,devmainnet is the main network, holesky is the ETH Sepolia test network, and dev is the local network.
Run the following command to start a full node on the holesky test network:
# Remember to replace /path/to/secret with your own path. You can get the specific path to jwt.hex from the Reth output.
reth node --full --chain holesky \\
    --authrpc.jwtsecret /path/to/secret \\
    --authrpc.addr 127.0.0.1 \\
    --authrpc.port 8551 \\
    --metrics 127.0.0.1:9001
2. Choose The Consensus Client
Here we choose Lighthouse as the consensus client, which is also implemented in Rust.
2.1 Set up the basic build environment
sudo apt update && sudo apt install -y git gcc g++ make cmake pkg-config llvm-dev libclang-dev clangSome of the packages were already installed when we installed the execution client, so they can be excluded.
Additionally, the Rust development environment is also necessary, but we have already installed it above, so it is not listed here.
2.2 Build the executable from the source code
- Download the Lighthouse source code
git clone <https://github.com/sigp/lighthouse.git>
cd lighthouse- Switch to the stable version
git checkout stable- Compile Code
make2.3 Start Lighthouse
Like Reth, Lighthouse also supports multiple networks, including:
mainnet, holesky, sepolia, chiado, gnosisWe must choose the same network as the execution client to ensure they work together correctly.
Run the following command to start Lighthouse and set it to the holesky network:
# Remember to use the same jwt.hex path as Reth for /path/to/secret
lighthouse bn --network holesky \\
    --checkpoint-sync-url <https://holesky.beaconstate.info> \\
    --execution-endpoint <http://localhost:8551> \\
    --execution-jwt /path/to/secret
Once the consensus client successfully starts, after waiting for a short period, you will see similar logs at the execution client Reth:

At this point, the checkpoint synchronization is in progress. After a while, you will see the following output:

This means Reth and Lighthouse have successfully coordinated.
3. Configure Reth metrics monitoring (optional)
In the previous steps, we enabled the Reth metrics monitoring feature using the --metrics 127.0.0.1:9001 parameter.
You can access it via:
curl 127.0.0.1:9001To verify if it has successfully started and is functioning correctly. It will output a lot of metrics data, but this is not very user-friendly for observation. We need to install Prometheus and Grafana to help us reduce the difficulty of monitoring.
3.1 Install Prometheus & Grafana
sudo apt install prometheusGrafana is not in the official default repository, so you need to add an additional source and then install it:
sudo wget -q -O - <https://packages.grafana.com/gpg.key> | sudo apt-key add -
echo "deb <https://packages.grafana.com/oss/deb> stable main" | sudo tee -a /etc/apt/sources.list.d/grafana.list
sudo apt-get update
sudo apt install grafana
3.2 Start Prometheus
sudo systemctl start prometheusSet Configuration File & Resolve Port Occupation Issues:
Here you can use the configuration file content recommended by Reth .
scrape_configs:
  - job_name: reth
    metrics_path: "/"
    scrape_interval: 5s
    static_configs:
      - targets: ['reth:9001', 'localhost:9001', 'host.docker.internal:9001']
  - job_name: ethereum-metrics-exporter
    metrics_path: "/metrics"
    scrape_interval: 5s
    static_configs:
      - targets: ['metrics-exporter:9091']
And write this content into the /opt/prometheus.yml file (the path can be adjusted freely, just synchronize the adjustment in the prometheus.service file).
prometheus runs on port :9090 by default. If this port is occupied, you can modify the systemd configuration file to adjust the port.
For example, my prometheus.service file path is:
/lib/systemd/system/prometheus.serviceIn the ExecStart configuration item of this file, add:
--config.file=/opt/prometheus.yml --web.listen-address=:9095This will set the service port to 9095. After that, reload systemd and then start the service.
3.3 Start Grafana
systemctl start grafana-serverGrafana's default port is 3000. Open ip:3000 in your browser, and if you see the Grafana page, it means the installation was successful.
The default username and password are both admin. You will be prompted to change the password immediately after logging in.
- Add the previously configured Prometheus as a data source
Navigate to: Configuration -> Data Sources -> Add data source -> Prometheus
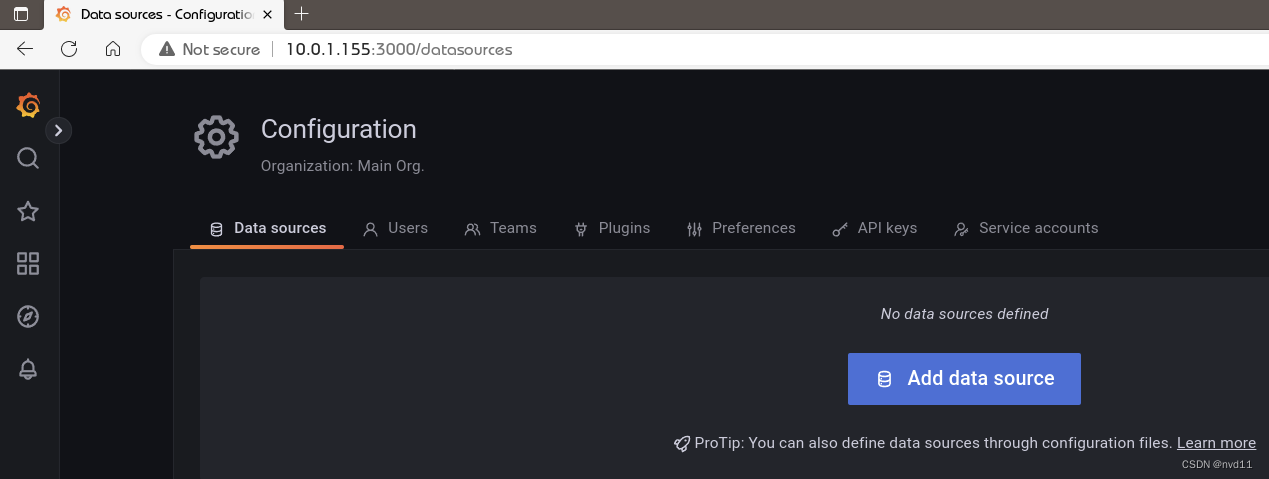
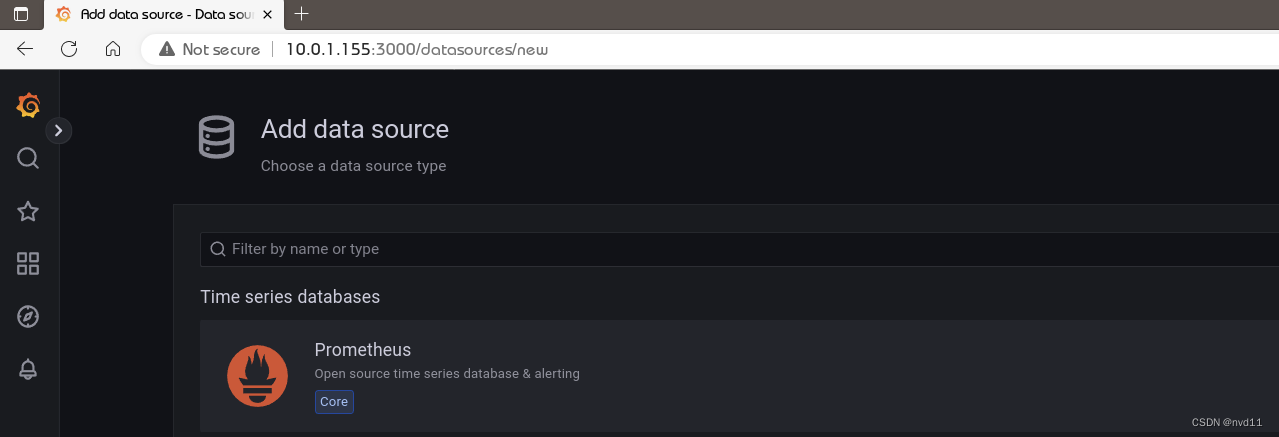
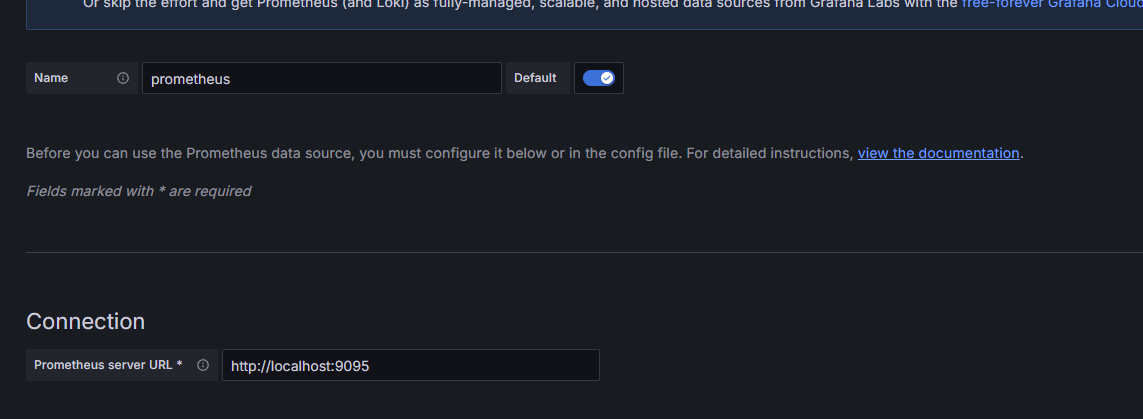
Make sure to set this port to the corresponding port number configured above.
- Configure the dashboard
To configure the dashboard in Grafana, click the square icon in the top left corner, then click ‘New’, and then click ‘Import’. From there, click ‘Upload JSON file’, and select the example file from reth/etc/grafana/dashboards/overview.json. Finally, select the Prometheus data source you just created, and click ‘Import’.
The effect after configuration is as follows:

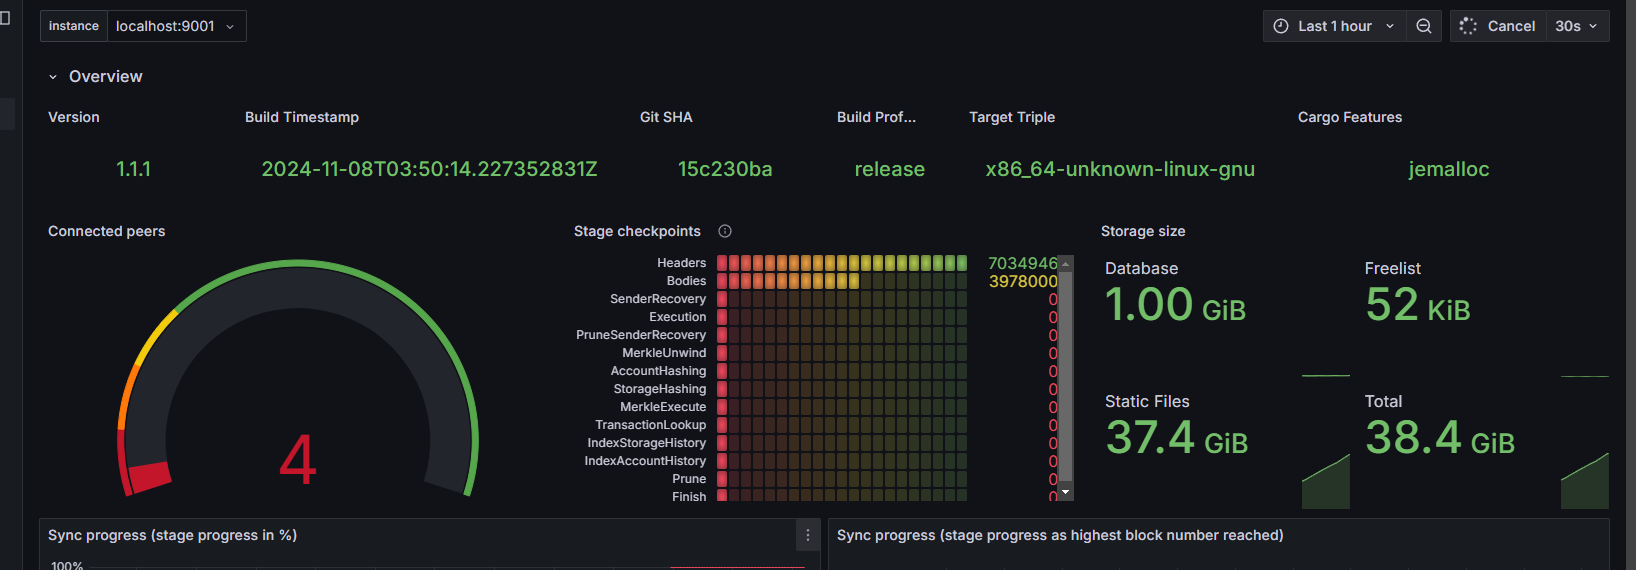
If not connected to any peers, the dashboard will appear empty, but once connected to peers, you should see it start populating with data.
4. Become a Validator
Note: You need to prepare 32 ETH on the Holesky network to complete the following tutorial
4.1 Create Validator Keys
The Ethereum Foundation provides the staking-deposit-cli for creating validator keys. You need to download the corresponding software based on your machine platform.
Then run the following command:
./deposit new-mnemonicGenerate the keys according to the instructions. When prompted to select a network, choose Holesky to run the Holesky testnet validator. A new mnemonic will be generated during this process. Simply follow the prompts, and when successful, you will see a prompt like the one shown in the image:
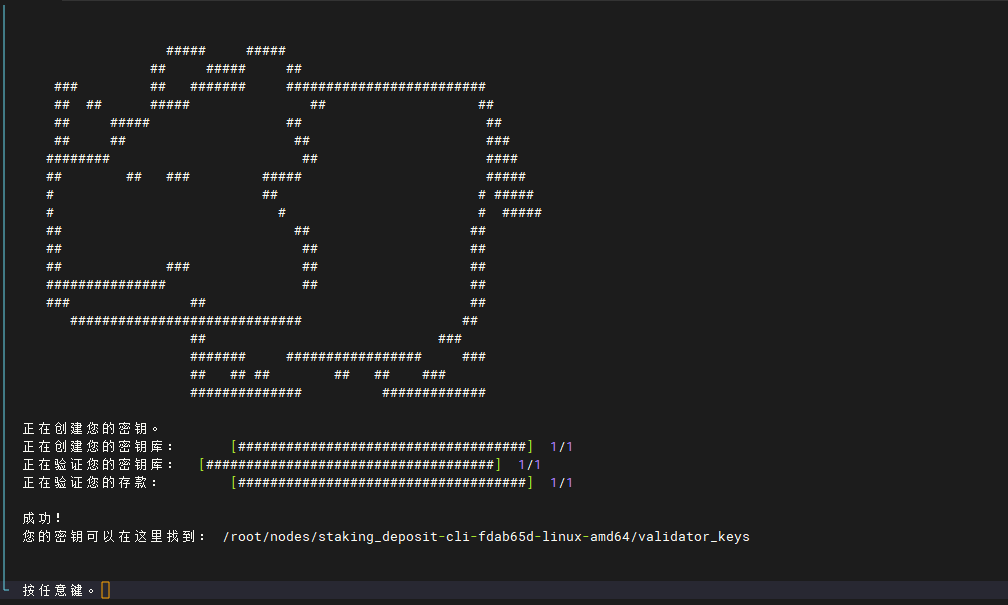
Important Note: The mnemonic (or seed phrase) is a randomly generated string of 24 words during this process. It is highly recommended to write down the mnemonic and store it offline. It is crucial to ensure that the mnemonic is never stored in any digital form connected to the internet (computer, phone, etc.). Also, make one or more backups of the mnemonic to ensure that your ETH is not lost in case of data loss. Keeping the mnemonic private is very important as it represents your ultimate control over your ETH.
After completing this step, the files deposit_data-*.json and keystore-m_*.json will be created. The keys generated from staking-deposit-cli can be easily loaded into the Lighthouse validator client (lighthouse vc) in the third step. In fact, these two programs are designed to work together.
By the way, you will need to set a password during this process. Make sure to remember this password, as it will be required during the import and for many future operations.
4.2 Start Reth & Lighthouse and wait for synchronization
The startup operations have already been completed above. The main task now is to wait for synchronization between the two clients and to catch up to the latest height of the mainnet.
4.3 Import Validator Keys into Lighthouse
Import the validator keys into Lighthouse.
lighthouse --network holesky account validator import --directory /root/nodes/staking_deposit-cli-fdab65d-linux-amd64/validator_keys
Do not forget to replace with your own local path.
Additionally, do not use the same validator key for different clients, as this will result in penalties.
4.4 Start the Lighthouse validator client
After importing the keys, the user can start the Lighthouse validator client to begin performing their validator duties:
lighthouse vc --network holesky --suggested-fee-recipient YourFeeRecipientAddressDo not forget to replace YourFeeRecipientAddress with your fee recipient address.
When lighthouse vc starts, check if the validator public key appears as voting_pubkey, as shown below:
INFO Enabled validator voting_pubkey: 0xa5e8702533f6d66422e042a0bf3471ab9b302ce115633fa6fdc5643f804b6b4f1c33baf95f125ec21969a3b1e0dd9e56Once this log appears (and there are no errors), the lighthouse vc application will ensure that the validator starts fulfilling its duties and earning rewards through the protocol.
4.5 Submit Deposit
After successfully running and synchronizing the execution client, beacon node, and validator client, you can now proceed to submit the deposit. Go to the mainnet staking launchpad (or the Holesky staking launchpad for testnet validators) and carefully complete the steps to become a validator. When ready, you can submit the deposit by sending 32 ETH per validator to the deposit contract. Upload the deposit_data-*.json file generated in Step 1 to the staking launchpad.
4.6 Complete the staking launchpad checklist
Please be sure to patiently complete the CheckList, as it is extremely important for the security of your assets.
4.7 Check Validator Activation Progress
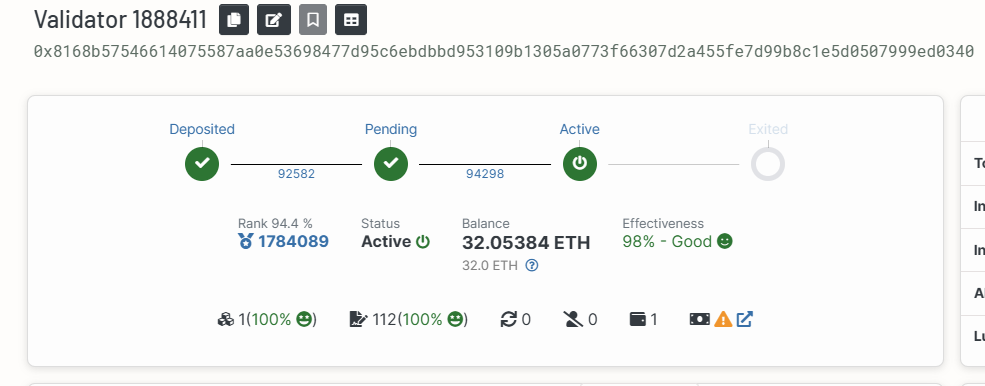
After submitting the transaction to become a validator, even if the transaction is executed successfully, the validator does not become active immediately. It requires a waiting period, usually between 16 hours to a week. You can check the progress using the pubkey from the deposit_data-*.json file on beaconcha.in. This is a Example.
After the waiting period, you can check if the status is Active. If it is Active, it means the process was successful.
4.8 Next Step
Once the validator is running and fulfilling its duties, it is important to keep the validator online to continue accumulating rewards. However, issues with the computer, internet, or other factors may cause the validator to go offline. To address this, it is best to subscribe to notifications, such as through beaconcha.in, which will send alerts about missed attestations and/or proposals. You will receive notifications about the validator’s offline status and be able to react quickly.
The next important thing is to stay informed about updates to Lighthouse and the execution client. Updates are released periodically, usually once or twice a month. For Lighthouse updates, you can subscribe to notifications on Github by clicking Watch. If you only want to receive notifications about new releases, select Custom and then choose Releases. You can also join the Lighthouse Discord, where announcements are made when new versions are released.
If you are still interested, you can also try setting up Siren, a UI developed by Lighthouse for monitoring validator performance.
Additionally, there is a fixed process for validator exit, which is not covered in this tutorial. You can refer to the consensus client’s documentation for the procedure. An improper validator exit process may lead to a loss of funds, so please proceed with caution!
5. Conclusion
Thanks to the excellent work of Ethereum client developers, when you have gone through the entire tutorial and performed the actual deployment, you will find that the whole staking deployment process is not complicated. Feel free to give it a try!
Additionally, if you intend to use it in a production environment, be sure to spend some effort on operations and monitoring, as they are crucial for ensuring the security of your funds (although the penalty for simply being offline is very low, I believe no one would want to incur unnecessary losses). Once you have configured the monitoring system, you don’t need to interact with it daily, just keep an eye on it. Happy staking!